
Cloud & Infrastructure • 7 days ago • Jessica Mahone
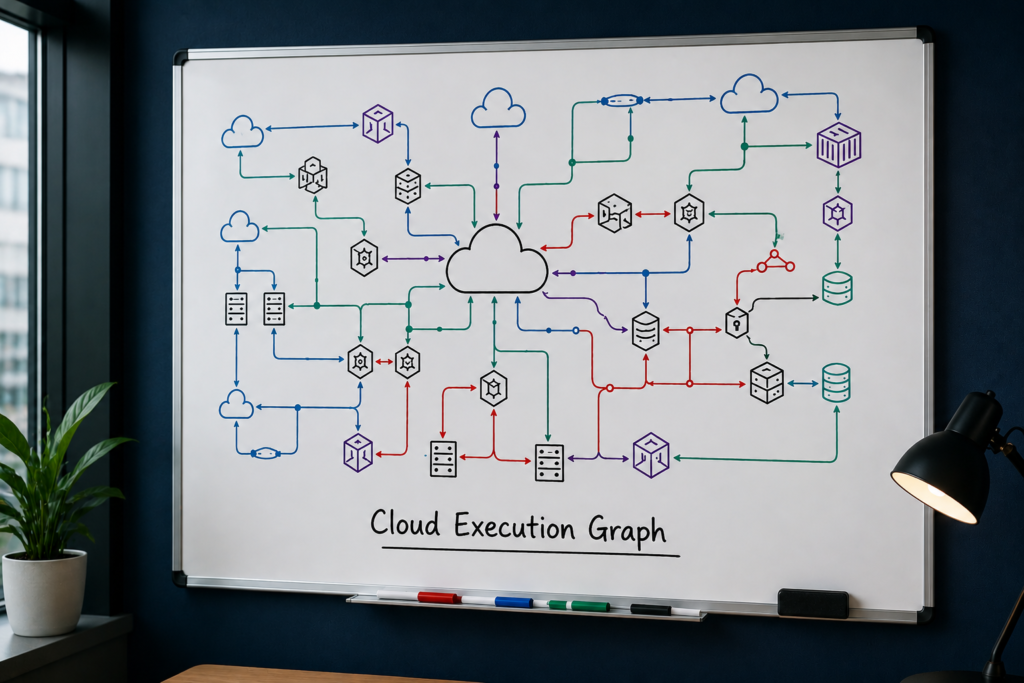
Modern enterprise cloud infrastructure has become a highly interconnected ecosystem where every operational action influences numerous systems simultaneously. A single application deployment can initiate hundreds of automated activities across compute resources, containers, networking, storage, identity platforms, security controls, APIs, databases, monitoring systems, and deployment pipelines. What appears to be a simple infrastructure change often triggers an intricate chain of events extending throughout the enterprise.
Despite this growing complexity, many organizations continue managing cloud operations through isolated dashboards, dependency maps, and monitoring platforms that reveal individual components but rarely illustrate how infrastructure actions actually propagate through the environment. Engineering teams can usually identify which resources exist and whether they are healthy, yet they often struggle to visualize the complete operational journey of a change from initiation to final business impact.
This lack of execution visibility has become increasingly expensive. Unexpected service interruptions, failed deployments, cascading infrastructure failures, inefficient troubleshooting, and prolonged recovery efforts frequently originate from operational pathways that were never fully understood before changes were introduced.
Cloud Execution Graphs are emerging as an intelligent architectural capability designed to solve this challenge. Rather than simply documenting infrastructure relationships, they model how infrastructure actions move across enterprise systems in real time. By representing operational execution as a connected graph of events, dependencies, and outcomes, organizations gain unprecedented visibility into how cloud infrastructure actually behaves before, during, and after every significant change.
Why Static Infrastructure Maps Are No Longer Enough
Infrastructure documentation has traditionally focused on describing enterprise assets. Organizations maintain inventories of servers, cloud resources, virtual networks, storage platforms, Kubernetes clusters, databases, applications, APIs, and security systems. Dependency maps illustrate which services communicate with one another, while architecture diagrams explain high-level system designs. Although these tools remain valuable, they primarily describe infrastructure structure rather than infrastructure behavior.
Enterprise infrastructure rarely remains static. Applications continuously scale, workloads migrate across regions, containers start and stop automatically, policies evolve, traffic patterns shift, security controls adapt, and deployment pipelines introduce new software throughout the day. A static architecture diagram cannot explain how an infrastructure action initiated within one environment gradually affects dozens of interconnected systems elsewhere. Cloud Execution Graphs address this limitation by focusing on operational movement instead of architectural structure.
What Is a Cloud Execution Graph?
A Cloud Execution Graph is a dynamic representation of how infrastructure actions propagate across enterprise cloud environments through connected execution paths. Instead of documenting only system relationships, the graph captures the sequence of operational activities generated by infrastructure events. An execution path may include:
- Deployment pipeline execution.
- Infrastructure provisioning.
- Configuration updates.
- Identity verification.
- Network routing changes.
- Application startup.
- Database synchronization.
- Security policy evaluation.
- Monitoring activation.
- Business service availability.
Each activity becomes part of a connected operational graph illustrating not only what occurred but also how every action influenced subsequent events. This allows engineering teams to observe infrastructure as a continuously evolving operational system rather than a collection of independent resources.
The Core Components of a Cloud Execution Graph
Building meaningful execution graphs requires integrating multiple operational perspectives.
Execution Nodes represent infrastructure activities such as deployments, workload migrations, scaling events, policy enforcement, service discovery, authentication, application initialization, and resource provisioning.
Execution Relationships connect these activities according to operational dependencies. Every node records which previous event initiated the current action and which downstream activities may follow.
Temporal Context captures when each operational event occurred, allowing engineering teams to reconstruct execution timelines during investigations or change reviews.
Operational Metadata enriches execution paths with information including workload ownership, cloud provider, application priority, compliance requirements, infrastructure health, and deployment version.
Outcome Tracking continuously records whether execution activities completed successfully, experienced delays, generated failures, or introduced downstream operational consequences.
Together, these elements create a living operational graph capable of representing enterprise infrastructure behavior with far greater accuracy than traditional architecture documentation.
Why Execution Visibility Improves Infrastructure Decisions
Understanding execution paths significantly improves operational decision-making. Consider a software deployment affecting a customer-facing application. Traditional deployment monitoring may confirm that new containers started successfully and application health checks passed. Cloud Execution Graphs provide a much broader operational perspective. The graph may reveal that:
- New application instances triggered unexpected database schema updates.
- Additional storage synchronization increased network utilization.
- Authentication services experienced temporary latency.
- Security policy validation delayed API availability.
- Monitoring agents generated elevated telemetry.
- Customer transactions experienced increased response times despite successful deployment.
Rather than viewing these events independently, engineering teams observe the complete execution journey from deployment initiation to business outcome. This operational transparency enables earlier intervention while reducing unintended consequences.
Artificial Intelligence and Execution Graph Analysis
Artificial intelligence substantially expands the value of Cloud Execution Graphs by continuously analyzing operational pathways across enterprise infrastructure. Instead of reviewing thousands of execution events manually, AI identifies recurring execution patterns, predicts downstream consequences, recommends infrastructure optimizations, and detects execution anomalies before business services become affected. Practical AI applications include:
- Predicting cascading failures following infrastructure changes.
- Identifying execution bottlenecks across deployment pipelines.
- Detecting inefficient operational workflows.
- Recommending optimized deployment sequences.
- Evaluating infrastructure recovery strategies.
- Comparing successful execution patterns with failed deployments.
- Estimating operational risk before significant infrastructure changes.
AI therefore transforms execution graphs from visualization tools into intelligent operational decision platforms. Infrastructure teams gain not only visibility but also actionable guidance.
Business Benefits Beyond Change Management
Although Cloud Execution Graphs significantly improve deployment visibility, their enterprise value extends much further. Incident investigations become considerably faster because engineering teams can trace operational events through complete execution pathways rather than manually correlating logs across multiple platforms.
Infrastructure resilience improves as organizations identify fragile execution chains before failures propagate across production environments. Operational governance becomes more effective because execution graphs reveal whether infrastructure changes consistently follow approved workflows, compliance requirements, and security policies. Engineering productivity also increases. Platform teams spend less time reconstructing infrastructure events after incidents because execution history already exists as an interconnected operational record. Cloud optimization benefits as well. Organizations identify unnecessary execution steps, duplicated workflows, and inefficient automation sequences that increase operational costs without delivering additional business value.
Perhaps most importantly, Cloud Execution Graphs establish shared operational understanding across cloud engineering, platform teams, application owners, security specialists, networking teams, and executive stakeholders.
Building an Enterprise Execution Graph Strategy
Organizations should begin by identifying critical operational workflows rather than attempting to graph every infrastructure activity immediately.
Deployment pipelines, application scaling, disaster recovery, workload migration, security enforcement, and cloud provisioning often provide the greatest initial value because these activities influence numerous enterprise systems.
Standardizing operational metadata is equally important. Execution graphs become significantly more valuable when infrastructure actions consistently include ownership information, application identifiers, business priorities, compliance classifications, and operational context.
Continuous synchronization also plays a critical role. Enterprise environments evolve rapidly, making automated discovery essential for maintaining accurate execution pathways.
Finally, Cloud Execution Graphs deliver maximum value when integrated with Operational Knowledge Graphs, Infrastructure State Intelligence, Infrastructure Signal Engineering, Cloud Context Engineering, Cloud Decision Intelligence, Infrastructure Reasoning Engines, and Infrastructure Intent Systems. Together, these capabilities establish an intelligent operational platform capable of understanding infrastructure relationships, operational state, execution behavior, and business impact simultaneously.
The Future of Intelligent Infrastructure Execution
Enterprise cloud environments will continue growing more autonomous as artificial intelligence, policy-driven automation, distributed applications, and hybrid infrastructure become increasingly common. In this environment, understanding how infrastructure executes changes will become just as important as understanding infrastructure itself.
Cloud Execution Graphs represent an important evolution because they provide a dynamic view of enterprise operations rather than static infrastructure documentation. They enable organizations to visualize how every significant infrastructure action travels across interconnected systems, revealing opportunities to improve resilience, governance, efficiency, and operational confidence.
The organizations that embrace execution-centric visibility will move beyond simply managing infrastructure components. They will understand the operational pathways connecting every deployment, policy change, workload migration, and infrastructure decision. As enterprise cloud platforms become increasingly intelligent, Cloud Execution Graphs will provide the operational transparency required to ensure automation remains predictable, explainable, and aligned with business objectives.